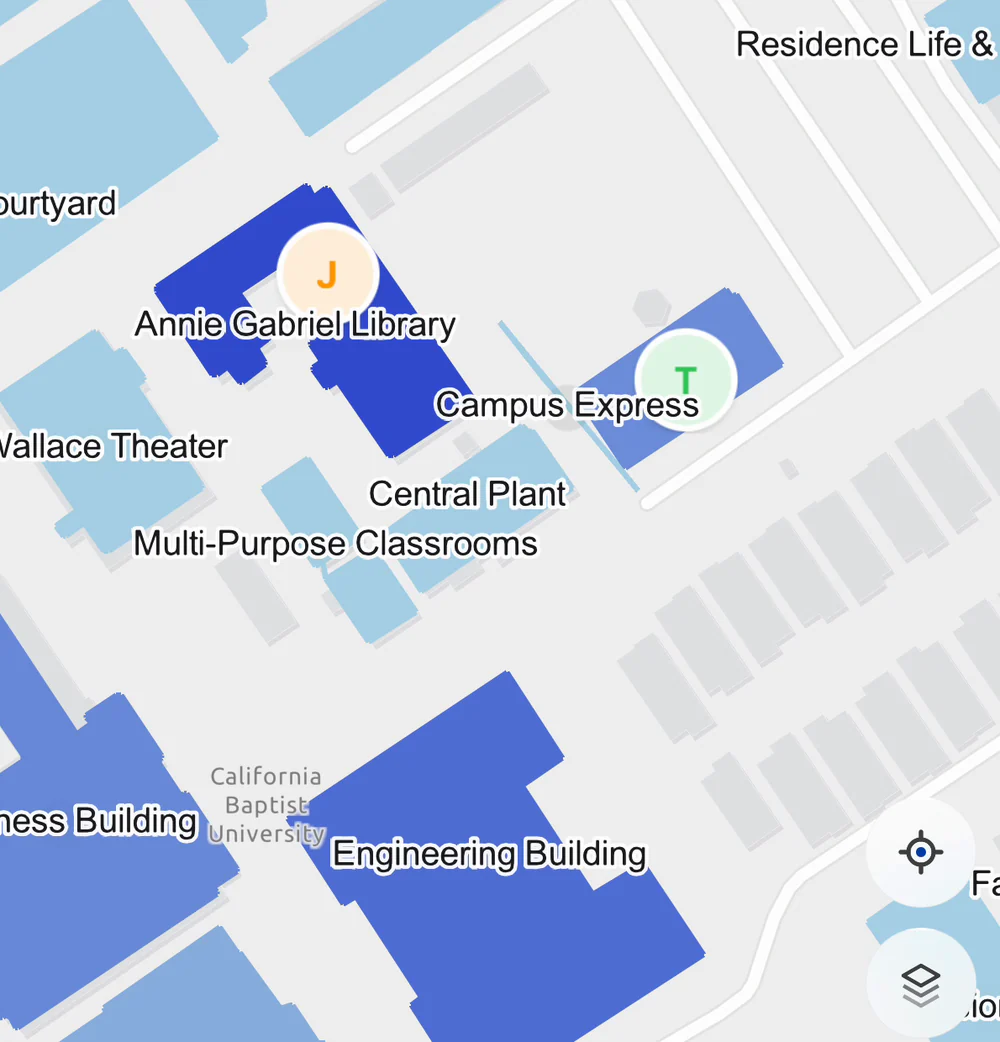
It tells you how busy a building is before you walk there. I designed the estimate to fuse three sources, geofenced presence, passive Bluetooth and user reports, each weighted by how far it can be trusted.
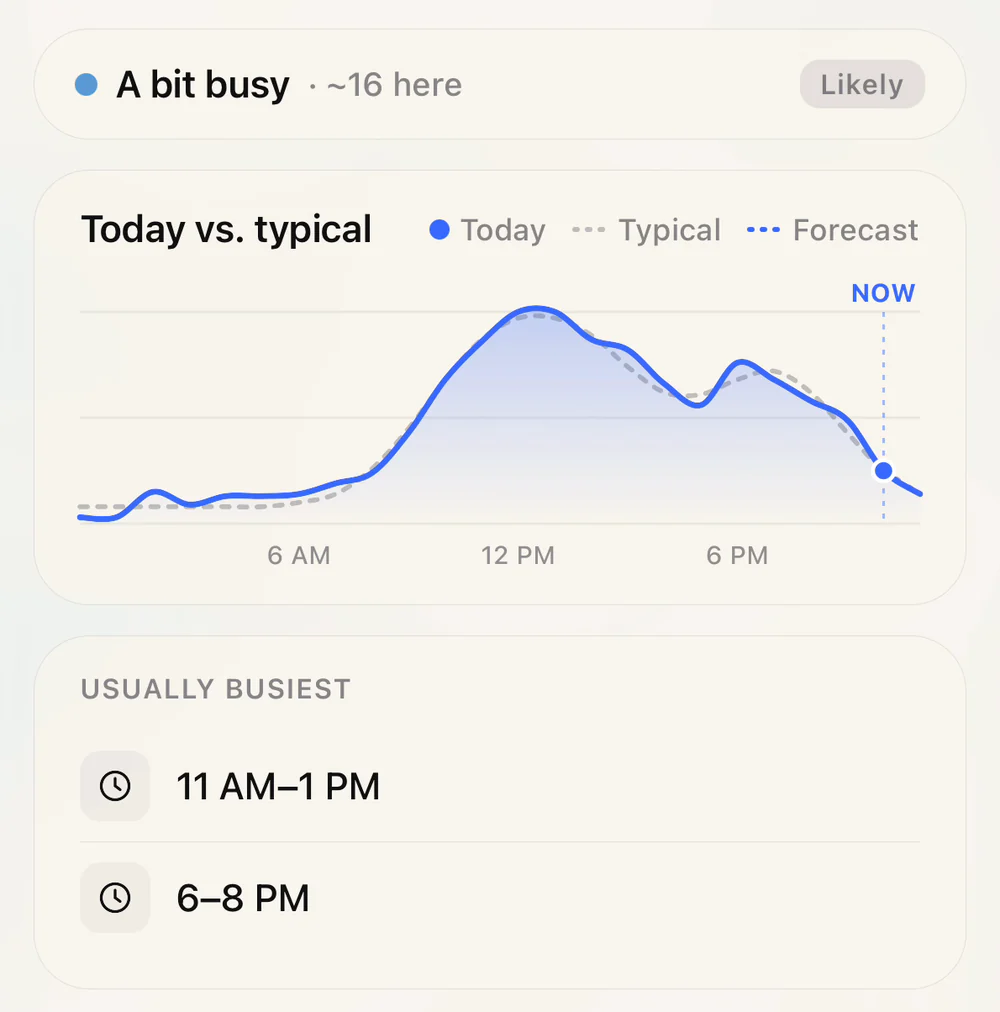
The forecast
Behind the chart is a prediction engine I wrote. It is a small machine-learning model, not a neural network: every 15 minutes it folds the latest reading into each building's profile of the week, hour by hour, and every hour it blends what it has learned with a starting guess built from class schedules, trusting the data more as more of it arrives. The rest of today is then projected from how the day is tracking against a typical one.